The ability to calculate lethality is a useful feature in the MadgeTech 4 software. MadgeTech 4 contains formulas that allow the user to automatically calculate A0, F0, Fd, Fh, and Pasteurization Units (PU), using either Math Channels or Statistics Reports. Instructions for adding lethality statistics to reports can be found in the following article: Calculating Lethality in MadgeTech 4 | MadgeTech
While Math Channels and Statistics Reports will use the same mathematical formulas to calculate lethality, there is an important distinction in the behavior of the two methods that users should be aware of when analyzing lethality results. Math Channels will automatically detect new lethality cycles when calculating lethality values, while lethality statistics added to a Statistics Report will not.
Math Channels
Math Channel lethality calculations will compare the “Tmin” value to the temperature recorded by the logger to determine when a new lethality cycle has started. While MadgeTech 4 contains default Tmin values for all lethality calculations, the Tmin value, as well as all other variables in the lethality calculation, should ultimately be determined based on the requirements of the lethality process and can be changed by the user when configuring the Math Channel.
Lethality values begin to increase from 0 once the temperature recorded by the selected logger channel rises above Tmin. This begins the first lethality cycle. The lethality value will continue to increase while the recorded temperature remains above Tmin (the rate at which it increases will be determined by the values entered for the additional lethality variables). When the recorded temperature for a cycle drops below Tmin, the lethality value will remain at the maximum value detected for the cycle, until the logger is stopped, or a new cycle is detected.
Subsequent lethality cycles will be detected when the recorded temperature has fallen below, and then rises back above, the Tmin value. When this occurs, the lethality value will reset to 0, and a new cycle begins. This process will repeat, with the F0 value resetting to 0 each time the recorded temperature falls below, and then rises back above Tmin, for the duration of the dataset.
The table below shows example data from a dataset containing multiple lethality cycles, as detected by a Math Channel in MadgeTech 4. The example uses the F0 lethality calculation with a Tmin value of 100 °C. Please note that the temperature readings are taken from an example dataset and are not meant to reflect a realistic lethality cycle.
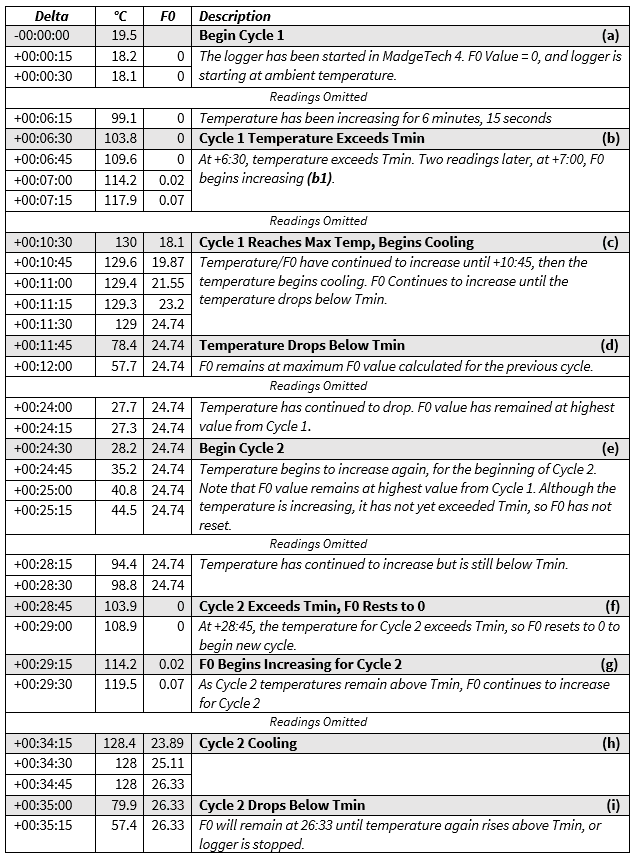
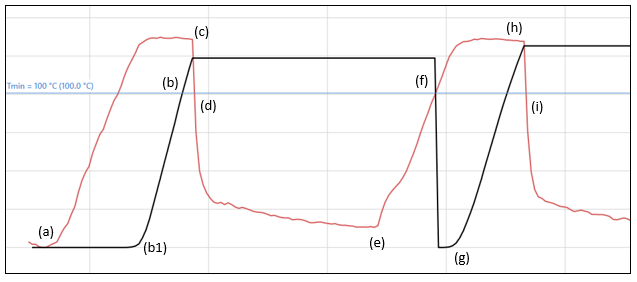
The screenshot below shows a graph of the data in the table above. Note that the letters (a) through (i) in the graph roughly illustrate when the corresponding entry from the table occurs.
Statistics Channel
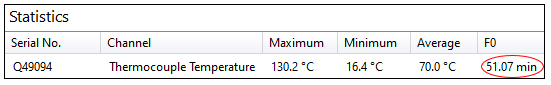
Lethality values calculated in Statistics Reports do not use automatic cycle detection. If multiple cycles are recorded in a single dataset, the lethality value in a Statistics Report will never reset to 0. The report will instead display the cumulative total for the lethality value from all cycles.
Below is a partial screenshot of a Statistics Report generated from the same dataset used in the example for Math Channels. Note that the F0 value in the statistics report is equal to the sum of the highest values from each cycle in the example above: 24.74 + 26.33 = 51.07.